Algorithmic matching in foster care: Help or harm?
Research and analysis by Stavroula Chousou, Yasmine El-Ghazi, Ludovica Pavoni, Lea Roubinet & Morgan Williams
Table of contents
- Introduction
- Research questions
- Literature review
- Methodology
- Results
- Limitations
- Discussion
- Annex
- Google Notebooks
- References
Introduction
In the United States, there are over 400,000 children in foster care on any given day, with over 200,000 children entering and exiting each year (US ACF, 2021). While many children are placed in group homes, relatives’ homes and other institutions, the largest share (45%) of children are placed in non-relative foster family homes (US ACF, 2021). With the average age of children in foster care being 8.4 years old, placement in non-relative foster family homes is a delicate task. Children in this age group have high developmental needs, and misplacement may result in short and long-term implications on the child’s mental health, emotional wellbeing, academic success and more (Leslie et. al, 2005).
Despite the large number of cases and effort required to ensure that children are cared for and given the resources they need to succeed, the Child Welfare Departments across the country remain under-resourced and under-funded (Saxena et. al, 2020). In order to maximize their limited resources, some Child Welfare Departments have begun experimenting with algorithmic tools to assist social workers with decision-making, such as predicting risk of maltreatment, recommending placement settings, and matching children with foster parents who are able to accommodate for their unique needs (Saxena et. al, 2020). While some tools have been commended by researchers for their improvements to child-outcomes and cost reductions, other analyses skepticize that the tools are biased, difficult to explain, or opaque (Saxena et. al, 2020; Church & Fairchild, 2019; Tushnet, 2018).
A wide range of tools have been deployed to facilitate decision-making and each employs different indicators in their models. Saxena et. al’s (2020) systematic review of research papers regarding algorithms in Child Welfare Services, found that child demographics were discussed in 40% of papers and only 4% of papers discussed foster-parent demographics. According to Mesa (2022), placement in a same-race household can provide foster children with a more familiar environment that leaves them less vulnerable to social isolation and emotional health struggles. As a result, children in mixed-race foster family homes may struggle to form their racial identity and feel connected to family members and members of the community.
This analysis examines the inclusion of foster child and foster parent demographics into parent-child matching algorithms. In the first analysis, researchers assessed whether demographic variables in the Adoption and Foster Care Analysis and Reporting System 2015 (AFCARS) dataset are representative enough to undermine potential biases in parent-child matching tools if it were used as training data. In the second analysis, researchers examined whether the use of parent-child matching tools in Kansas resulted in a higher share of same-race placements compared to neighboring states.
Research questions
The subsequent sections attempts to answer the following questions:
RQ1: Is there racial overrepresentation among foster families?
RQ2: Is AFCARS representative enough to be used as a training data set?
RQ3: Are states that use placement recommendation models or child-foster parent matching models more likely to take into account children’s wellbeing by placing them in same-race households?
Literature review
There is a gap in the existing literature on the American foster care system and the decision-making processes involved when it comes to children’s or parents’ demographic characteristics, including racial and ethnic disparities. Research suggests that the matching of these features is a strong indicator for the child’s successful integration in the foster home, for their psychological development, but also for their positive performance later in life. Kids’ of a certain racial profile can thrive in different- race homes, however foster parents attest that a child’s trauma of leaving their families to live with strangers may result in further unsettlement when factoring the racial divide (KCUR, 2022) (U.S. Department of Health and Human Services, 2002) (Saxena et al., 2020).
In the US, data indicate the existing discrimination against Black children as opposed to White children in both the foster-care and adoption system (Baccara et al., 2014). Indeed there seems to be a mismatch between the preferences of PAPs (the demand side) and the characteristics of children relinquished for adoption by BMOs (the supply side), especially when it comes to adoption (Baccara et al., 2014). This could potentially be explained by the mere fact that White people apply for adoption much more than their Black counterparts, and would likely look for children that look like them (Baccara et al., 2014). This results in a problematic situation where the remaining unmatched children are placed in the foster care system - 23% of which are Black children in 2021 (Table 1). While discrimination against Black children in the foster care system is evident, existing analyses do not identify significant disparities for children of Hispanic or Asian descent to define potential discrimination.
This overrepresentation in the foster care system creates the need for more Black foster parents. Yet again, there is a strong disparity, as most foster parents are White (f.i. 80% in Kansas). Existing research shows that this exclusion derives from a variety of factors, such as extremely specific and elitist educational and home requirements. (U.S Senate, 2020). For example, in the state of Virginia there is a requirement of having a special college degree in order to be enrolled in the foster care system. Although those requirements are detrimental for the chances of the majority of potential foster parents, they are especially detrimental for the minority populations wishing to be enrolled.
Other institutional factors further complicate the scenery. According to the US Senate (2020), only 8% of people who inquire about becoming foster parents eventually become licensed. This is the outcome of a chronic lack of a designated support agency to help candidates become foster parents. The same systemic inadequacy is observed with the intertemporal lack of federal or state foster care funding for recruiting foster parents. Moreover, most states’ foster care systems and partner organisations do not comply with the Multiethnic Placement Act, requiring further assessment for placement of children in a different race-foster-family (U.S Senate, 2020). Indeed, the Multiethnic Placement Act, passed in 1994, prohibits the delay or denial of placement of a child on the basis of race, colour or national origin. However, many states have already violated this law. In the early 2000s, the U.S. Department of Health and Human Services’ Office of Civil Rights found that Ohio or South Carolina were violating the Multiethnic Placement Act. For example, they subjected parents to a higher level of scrutiny if the parent was of a different race than the child, or assessed the racial composition of the neighborhood of prospective foster families in order to match children with parents based on skin tone (U.S Senate, 2020).
All the aforementioned considerations and institutional disparities, combined with the rising number of children in need of foster homes, enhance the need for a systematized placement decision-making process, in an unbiased and objective manner. Therefore, placement algorithms have emerged to assist the CWS in this task. Currently different types of algorithms are used such as the decision tree learning system, the CART, or the SDM model (Saxena et al., 2020). The Classification and Regression Trees (CART) algorithm is particularly used to identify the characteristics of the most troubled children within the foster-care system, or to study trends in child abuse in order to build a child-parent matching system. On the other side, the Structured Decision-Making (SDM) model provides a framework combining risk assessment and clinical assessment thanks to machine learning and is used by many states. However, several studies have shown that the SDM model provides mixed and biased results when accounting for race and ethnicity. (Saxena et al., 2020)
Those algorithms are trained either by inferential statistics methods or machine learning. Inferential statistics is the most common training method (68% of papers), with 28 papers (56%) using a form of a generalized linear model (GLM). This type of training utilizes psychometric models and past history of both potential parents’ and children. Therefore they have many critics, who perceive them as biased and most importantly non-contextual. Even algorithms trained by machine learning methods fall into the broader category of categorizing different levels of risk or indicating possible matches for different foster care entries. Therefore, there is a clear emphasis on risk assessment - e.g. potential maltreatment, harm, neglect, sexual harassment - than on the valuable predictors of positive outcomes for foster children, such as cultural and social characteristics of the matching families, potential for the children to bond with foster families etc. This trait follows the long-lasting practice of CWS itself, which always focuses on risk aversion, rather than positive outcomes for the children in the long run (US Department of Health and Human Services, 2019).
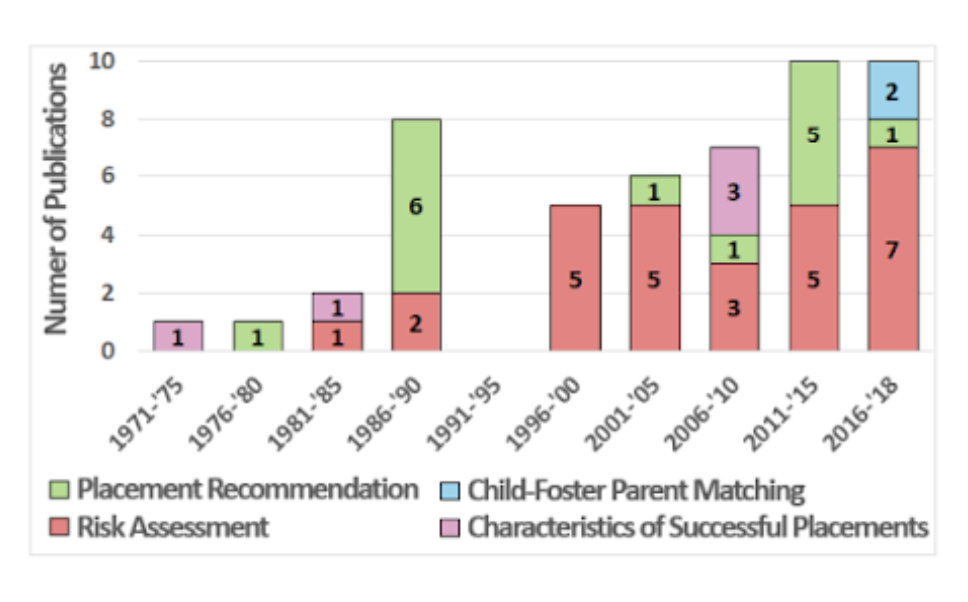
Research suggests that the variety of laws and policy drafts, as well as funding constraints, usually urge algorithms to be built as a useful tool for avoiding scandals, rather than actively contributing to placements with promising prospects for the childrens’ development. The following graph (Saxena et al., 2020) summarises and categorises a dataset of studies relating to the child placement system in the U.S. foster care system according to the major topics addressed by each study. Out of more than sixty studies analysed, only two studies examine the system of matching children with parents and their possible consequences, while the majority of studies focus on the notions of risk assessment. This underlines that the majority of the efforts in computational modelling of foster parent matching systems continues to be focused on risk assessment. According to Saxena et al (2020), the latest advances in algorithmic design and training could take into account the existing social sciences’ literature and strive for positive outcomes, but stagnant tradition, short-sightedness of the CWS regulators and lack of budget refrain those potentials from being explored.
Graph 1 : Source : Mariagiovanna Baccara, Allan Collard-Wexler, Leonardo Felli, and Lee at Yariv (2014), “Child-Adoption Matching: Preferences for Gender and Race”, American Economic Journal: Applied Economics, Vol. 6, No. 3, pp. 133-158
Methodology
In order to understand whether there is racial/socioeconomic overrepresentation among foster families and to examine the reality of foster care matching, the analysis employs the Adoption and Foster Care Analysis and Reporting System 2015 (AFCARS) dataset. Such data is compiled by the Children’s Bureau (CB) within the Administration for Children and Families (ACF).
The dataset is exhaustive as it provides data on children who enter foster care, their entries and exits, placement details, and foster/adoptive parent information, which helped us identify adoption trends. The dataset of course also provides data on the social and racial background of the children in the foster care system, as well as racial information of caretakers, both 1st and 2nd foster caretakers.
The first step in our analysis was the process of data cleaning where we considerably resized the dataset, going from 104 variables to 23. The variables we decided to keep are of course all the variables that help explain the racial background of the children and of the caregivers as well as the variables that provide information about the current location of the children within the foster care system and the variable that provides information about the geographical location of the child.
Data cleaning
# Limit columns to the ones that are necessary
foster_data_v2=foster_data_v1[['curplset','st',
'amiakn', 'asian', 'blkafram', 'hawaiipi', 'white',
'hisorgin', 'untodetm', 'rf1amakn', 'rf1asian', 'rf1blkaa',
'rf1nhopi', 'rf1white', 'hofcctk1', 'rf1utod','rf2amakn',
'rf2asian', 'rf2blkaa', 'rf2nhopi', 'rf2white', 'hofcctk2',
'rf2utod']]
The second step was limiting our observations in the variable ‘curplset’, to only the children who are currently in the foster, non-relative, and pre-adoptive homes. This decision was made because these are the children that would be affected by algorithmic matching. Once the data was sufficiently cleaned we were able to proceed with the analysis.
# Limit observations to those who live in a foster home, non-relative or pre-adoptive home
foster_data_v2= foster_data_v2.loc
[(foster_data_v2['curplset']== 'Foster home, non-relative')
| (foster_data_v2['curplset'] == 'Pre-adoptive home')]
To answer the first two research questions related to the representativeness of the dataset with regard to the American population, we started from the data cleaning carried out previously by choosing to focus on the following racial categories: White, Black or African American, Latino, Asian, American Indian or Alaska native and Hawaiian or other Pacific Islander for children, parent 1 and parent 2. We decided to not consider individuals whose race is undetermined.
For question one, we calculated the distribution of the different racial categories for children and parents to see if significant differences could be observed.
For question two, we selected two official data sources for the racial distribution of the entire U.S. population to assess the representativeness of our dataset. To do this we calculated fluctuation intervals based on the national distribution in order to compare it to the distribution of the AFCARS dataset.
The details of all the calculations for RQ1 and RQ2 can be found in the google notebook whose links are at the bottom of the page.
For question three, we started by encoding our data. We created a new dummy variable to distinguish between the children who fall into minority groups from those who do not fall into minority groups. Minority children are Black or African American, Asian, Hawaiian or Pacific Islanders, Indian or Alaska Native American, and children of Hispanic origin that are encoded as 1. In this phase we also dropped all those children whose race was undetermined. Non-minority children, the remaining White children therefore, are encoded as 0. We repeated the same procedure for 1st and 2nd foster parent, so we created a dummy variable that took value 1 if 1st parent was a minority and took value 0 if 1st parent was non-minority. We created a second variable that also took value 1 if 2nd parent was a minority and value 0 if 2nd parent was non-minority. These two variables were created in order to encode a third dummy variable that took value 1 if at least one parent is a minority and that took value 0 if 1st and 2nd parent are non-minority.
To understand the share of same-race households by race, we combined the variables resulting in a variable that took value 1 when children and parents’ races matched (so when a minority child was placed with minority parents and when a non-minority child was placed with non-minority parents). It took value 0 when such matching did not occur.
For the last step in our analysis we compared the share of same-race households in Kansas, a state that used algorithmic matching in 2015, with two surrounding states with similar demographic compositions, Colorado and Nebraska. We chose Kansas as our benchmark state because Kansas was one of the first states to adopt a matching algorithm, implemented by the US Child Welfare System, and it was one of the first and only states to use a child assessment tool to determine the appropriate level of care each child requires. As early as 2010, two sub-state regions under contract with Kansas, began using a web-based decision support tool called “Every Child a Priority” (ECAP) developed by TFI Family Services to provide placement match options based on an algorithm that used information froma child assessment and information on available placement resources (Moore, Thomas & Cronbaugh-Auld, 2016).
The details of all the calculations for RQ3 can be found in the google notebook whose links are at the bottom of the page.
Results
RQ1: Is there racial overrepresentation among foster families?
In order to determine whether there is an overrepresentation of a certain racial category on either the child or foster family side, we calculated the proportion of each racial category within the following populations: children, parent 1, and parent 2.
We obtained the following results:
print(f'Percentage of Asian kids: {asians_percentage}')
print(f'Percentage of Native American - Alaska kids: {amiakn_percentage}')
print(f'Percentage of African American kids: {blkafram_percentage}')
print(f'Percentage of White kids: {white_percentage}')
print(f'Percentage of Hawaian kids: {hawaiipi_percentage}')
print(f'Percentage of Latino kids: {hisorgin_percentage}')

Percentage of Asian kids: 0.01056836213837363
Percentage of Native American - Alaska kids: 0.03880798463731184
Percentage of African American kids: 0.25133211911815667
Percentage of White kids: 0.5171332014893678
Percentage of Hawaian kids: 0.004971507633140257
Percentage of Latino kids: 0.1771868249836498

# Make figure
fig = plt.figure()
ax = fig.add_axes([0,0,1,1])
races = ['Asian', 'Native - Alaska', 'African American', 'White', 'Hawaian', 'Latino']
percentages = [1.05,3.88,25.13,51.71,0.49,17.71]
ax.bar(races,percentages)
plt.show()
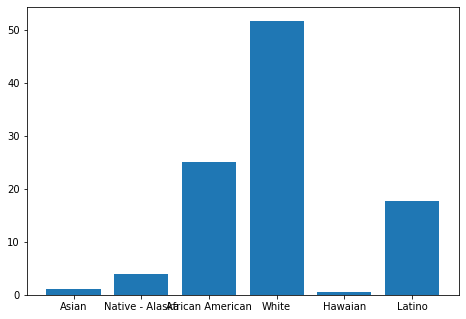
The most represented racial category among the children is White (51.7%), followed by Black or African-American (25.1%) and finally Latino (17.7%). The other three racial categories are very little represented since they all represent less than 5% of the total population.
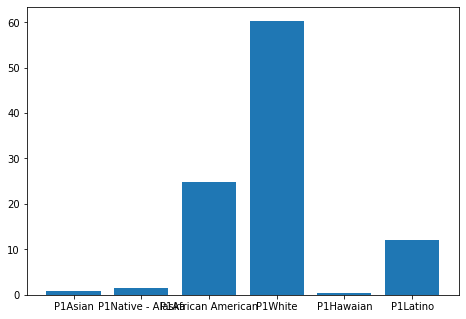
Regarding parents, it should be noted that the population of parent 1 is higher than that of parent 2. This significant difference is not explained. We assume that this can be explained by a large number of single-parent foster families or a lack of data. This would be the case for 104,643 families out of 295,348 (or 35.4%).
We obtained the following results:
# Parent 1:

print(f'Percentage of Asian parent 1: {asians_percentage_parent1}')
print(f'Percentage of Native American - Alaska parent 1: {amiakn_percentage_parent1}')
print(f'Percentage of African American parent 1: {blkafram_percentage_parent1}')
print(f'Percentage of White parent 1: {white_percentage_parent1}')
print(f'Percentage of Hawaian parent 1: {hawaiipi_percentage_parent1}')
print(f'Percentage of Latino parent 1 : {hisorgin_percentage_parent1}')

Percentage of Asian parent 1: 0.008633882741714859
Percentage of Native American - Alaska parent 1: 0.014410119587740564
Percentage of African American parent 1: 0.24792448230561914
Percentage of White parent 1: 0.6035998212278397
Percentage of Hawaian parent 1: 0.004418516461936427
Percentage of Latino parent 1 : 0.12101317767514931
# Parent 2:

print(f'Percentage of Asian parent 2: {asians_percentage_parent2}')
print(f'Percentage of Native American - Alaska parent 2: {amiakn_percentage_parent2}')
print(f'Percentage of African American parent 2: {blkafram_percentage_parent2}')
print(f'Percentage of White parent 2: {white_percentage_parent2}')
print(f'Percentage of Hawaian parent 2: {hawaiipi_percentage_parent2}')
print(f'Percentage of Latino parent 2: {hisorgin_percentage_parent2}')

Percentage of Asian parent 2: 0.010020712618966466
Percentage of Native American - Alaska parent 2: 0.013554967095776199
Percentage of African American parent 2: 0.14000157311030126
Percentage of White parent 2: 0.7082771820350804
Percentage of Hawaian parent 2: 0.005275163210193755
Percentage of Latino parent 2: 0.12287040192968197
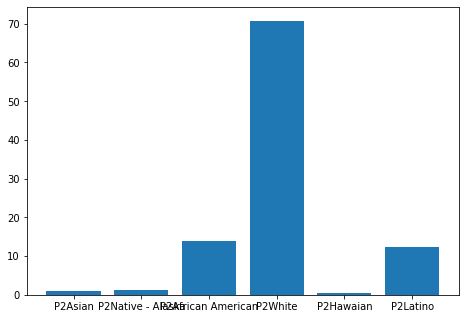
We also note that the most represented racial categories are: White (respectively 60.3% and 70.8%), Black or African American (respectively 24.7% and 14%) and Latino (respectively 12.1% and 12.2%). Here we see that the number of White foster families is proportionally larger than the proportion of White children (between 10 and 20 percentage points difference). This means that the proportion of racial minority families is lower than the proportion of racial minority children in foster care. Racial minority children are therefore more likely to have a foster family that is not from a racial minority.
RQ2: Is AFCARS representative enough to be used as a training data set?
With the results obtained previously, we wanted to know if the dataset was representative of the racial distribution of the American population. This representativeness is important in the case where this dataset would be used by algorithms and decision-making tools. If the dataset is not representative, these tools could be biased, which in the case of such sensitive subjects as placement, adoption and ultimately, the well-being of children, could have serious consequences.
The data on the racial distribution of children in the U.S. comes from the Kids Count Data Center. Data on the racial distribution of adults in the U.S. are from the United States Census Bureau (links are in the reference section). In both cases we used data for the year 2021.
Using the calculation of fluctuation intervals we found the following results:
We find that in general, the racial distribution within the AFCARS dataset for both children and parents is not representative of the U.S. population. We analyze some relevant results:
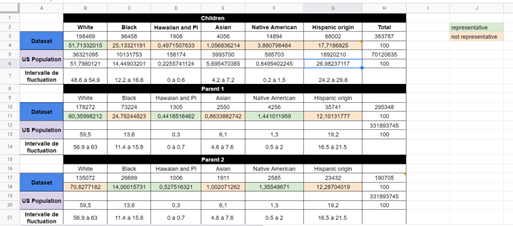
The proportion of White adults is representative of the U.S. population for parent 1 but the proportion for parent 2 is much higher than the proportion of White adults in the U.S. population. We can conclude that the dataset is partially representative in this regard and that limiting the study to the parent 1 population may be considered in the case of use for an algorithmic tool.
The proportion of Black or African American adults is higher than that observed in the general population for parent 1 but is representative for parent 2. We can make the same remark as in the previous point.
Black or African American children are significantly overrepresented compared to the distribution within the American child population (10 percentage points above the upper limit of the fluctuation interval). This finding may be explained by race-related socioeconomic conditions that impact the child’s living conditions.
A major point of analysis concerns Asian children and parents. They are significantly underrepresented in both the child and adult populations. We do not have an explanation for this. However, we can say that this underrepresentation could bias algorithmic placement or decision assistance tools.
RQ3: Are states that use placement recommendation models or child-foster parent matching models more likely to take into account children’s wellbeing by placing them in same-race households?
Given evidence from the literature suggesting that same-race placement is an important indicator of childhood outcomes, we assessed the extent to which social workers with and without algorithmic aid place foster children in same-race households.
# Create dictionary for figure
dict_race = {0:"White", 1:"Minority", "NaN":"Not available"}
foster_data_v3['child_race_plot'] = foster_data_v3['child_race'].apply(lambda x : dict_race[x])

# Make figure
fig = px.pie(foster_data_v3, names='child_race_plot', title="Foster Child Race",
             color='child_race_plot',
             color_discrete_map={'White': '#BC8F8F',
                                 'Minority':'#B0C4DE',
                                 'Not available':'#778899'})
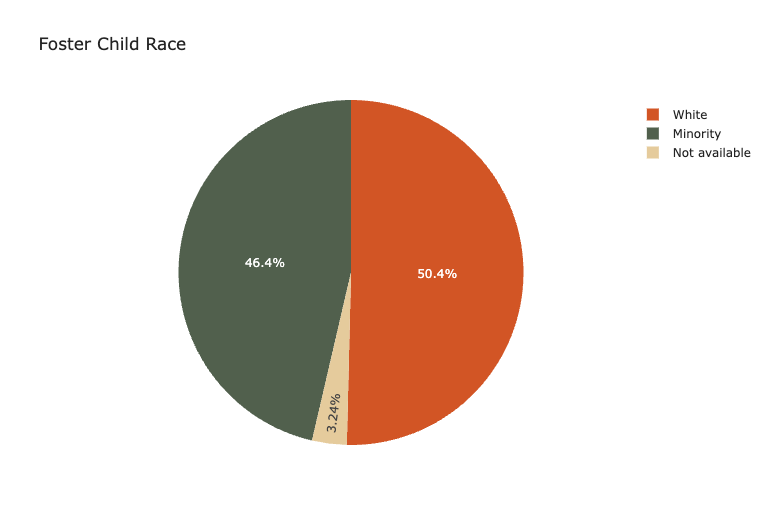
First, we examined the demographic composition of minority vs. White non-relative foster families. In the dataset, around half of foster children placed in non-relative foster care were White, and the rest were minorities, indicating a relatively even demographic dispersion.
# Create dictionary for figure
dict_race = {0:"No", 1:"Yes", "NaN":"Not available"}
foster_data_v3['parent_race_plot'] = foster_data_v3['atl1_parent_race'].apply(lambda x : dict_race[x])

# Make figure
fig = px.pie(foster_data_v3, names='parent_race_plot', title="Homes with at least one minority parent",
             color='parent_race_plot',
             color_discrete_map={'No': '#BC8F8F',
                                 'Yes':'#B0C4DE',
                                 'Not available':'#778899'})

fig.show()
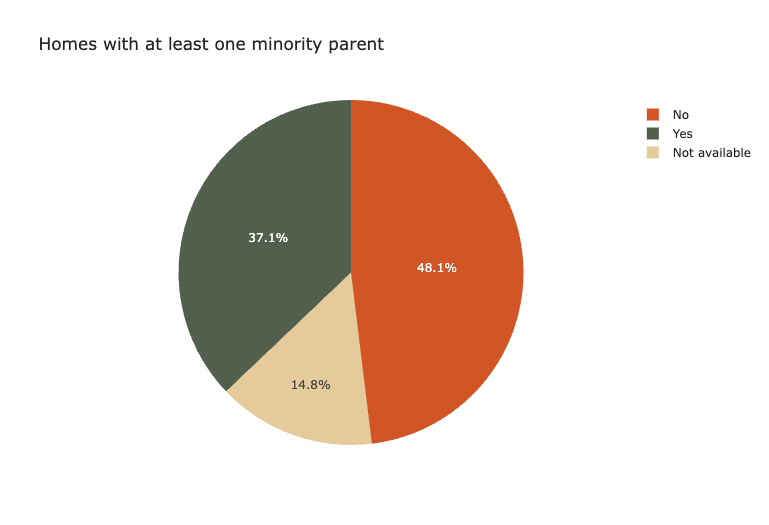
With that said, there were more White non-relative foster families than homes with at least one minority parent. Since the dataset only includes matched families and does not have access to all foster parent applications, it is conceivable that there were minority foster families on waiting lists and have not yet been matched with a foster child. However, this hypothesis is not supported by the literature.
# Create dataframe for bar graph
df_bar= pd.DataFrame(
    {"label":["% of total children", "% of minority children", "% of white children"],
     "value":[matching_percent[1],matching_minority[1],matching_white[1]]
    }
 )

# Create bar chart
fig = px.bar(df_bar, y="label", x="value", orientation="h",
       color="label",
       text_auto=".0%",
        color_discrete_map={"% of total children":'#778899',
                            "% of minority children":'#B0C4DE',
                            "% of white children":'#BC8F8F'},
       labels={"label":'', "value":''},
       title="Share of same-race households by race")

fig.update_traces(textposition="outside")
fig.update_layout(xaxis=dict(tickformat=".0%"))
fig.show()
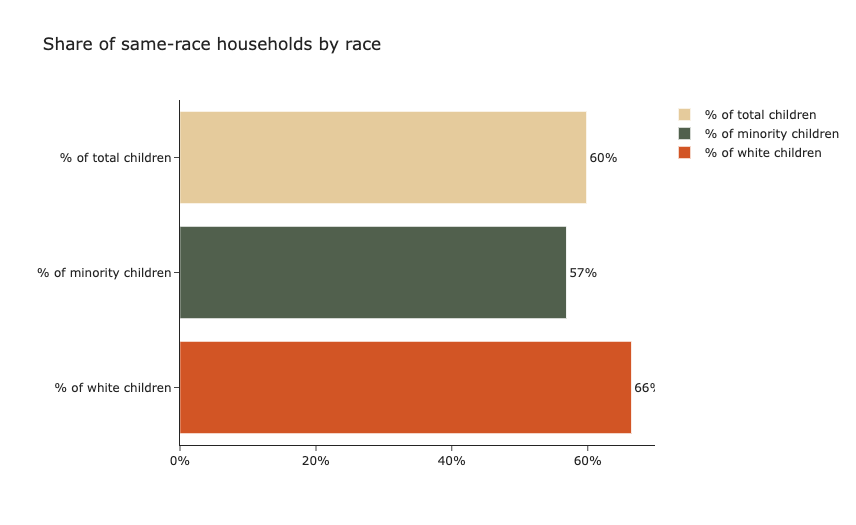
60% of children placed in non-relative foster families in 2015 were placed in same-race households. However, White children were 9 percentage points statistically significantly more likely to be placed in these households as compared to their minority peers.
# Create figure
fig = px.bar(df_bar2, x='label', y='value', color='state', barmode='group',
             text_auto=".0%",
        color_discrete_map={"Kansas":'#BC8F8F',
                            "Surrounding states":'#778899'},
       labels={"label":'', "value":'', 'state':''},
       title="Share of same-race households by state by race")

fig.update_traces(textposition="outside")
fig.update_layout(yaxis=dict(tickformat=".0%"))
fig.show()
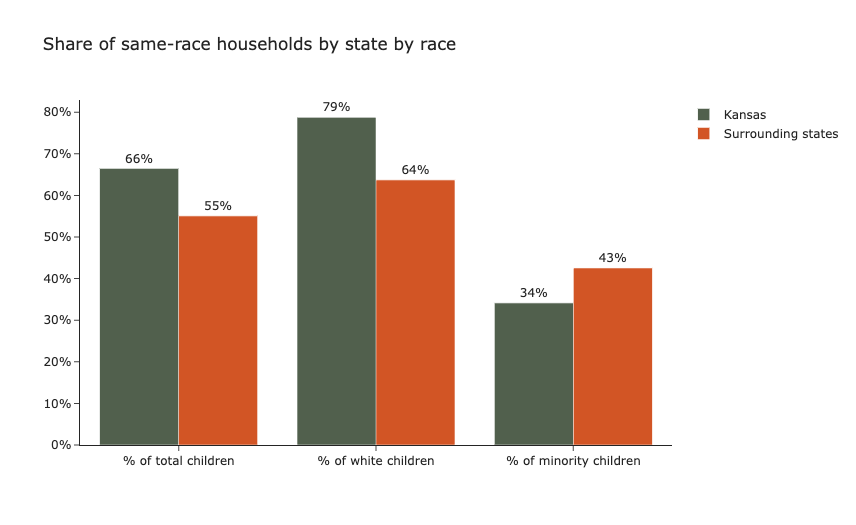
As outlined in the methodology section, we compared the share of same-race households in Kansas, a state that used algorithmic matching in 2015, with two surrounding states with similar demographic compositions, Colorado and Nebraska. When examining the results in aggregate, it appears that foster children in Kansas, were 11 percentage points more likely than in surrounding states to be placed in same-race households. However, sub-group analysis uncovers a more confounding finding: minority foster children in Kansas are 8 percentage points significantly less likely to be placed in same-race household, while White foster children in Kansas are significantly more likely to be placed in same-race households.
On one hand, it is reassuring that a system using algorithmic matching is significantly more likely to place children in same-race households in aggregate. On the other hand, a system using algorithmic matching significantly diminishes the likelihood of a minority foster child being placed in a home that generates long-term positive outcomes. As minority foster children are a particularly vulnerable sub-population, the results suggest that algorithmic matching may disproportionately disadvantage a group that is already systematically disadvantaged. Therefore, the algorithm may appear to developers and social workers that it improves outcomes for foster children, but in reality, it improves outcomes for white children at the expense of minority children.
Limitations
This study is only a primary introduction to the topic of algorithmic foster care matching, as more research should be done on the topic to gain an extensive understanding of its mechanisms. In the US only very few states have adopted algorithmic matching; therefore, additional research should be carried out once more data is available. What is more, there is no concrete way to access the specific architecture of the algorithms used in foster care, since they are not open-source. Therefore, we can not be sure of how different systems would create different outcomes for our data set, limiting the research to inferring possibilities based on the data set itself and the research documentation.
Going more in detail, the current analysis has some limitations data-wise as the dataset only has information for the 2015 year. This might impair our results as some placements in Kansas might have occurred before their implementation of algorithmic matching. Repeating the study with an updated dataset might lead to different results or might confirm our findings. Of course, repeating the research with updated data might also shed light on the progress that algorithmic foster matching might have had, it is possible that Kansas has adjusted its system so that more same race household placements have been observed.
As far as data limitation goes, the present dataset does not have any information on LGBTQ couples, so no data for the sex/gender of the foster parents. Once again, expanding the scope of the research to this field would also yield some interesting results. One final potential limitation is our own methodological approach, in the sense that we opted to group minorities into one group rather than matching each minority group, to avoid having complicated and overly specific results. We urge other researchers to build upon these points and address the uncovered issues in future endeavours. Our choice is also justified by the fact that we did not have enough data to find race specific matching. The data presented a significant number of non-assigned races to children and parents alike that would have skewed our results; moreover, considering that many 1st and 2nd foster parents do not have a same race it resulted difficult understanding under what criteria the matching would have been considered a same-race household matching. By having a more general approach we avoided incurring in such issue, but with more data it would be possible to increase the study’s specificity.
Discussion
Taking into account our literature review and our research results, we conclude that the endemic deficiencies in the foster care system raise considerable limits to the efficiency and effectiveness of successful placement algorithms. The need for an unbiased decision-making counselling tool has not been achieved, as training models and designing obsession with risk aversion slightly favour Caucasian children, at the significant expense of the already disadvantaged minority children. Keeping in mind that the CWS and the placement algorithms are influencing each other increasingly, we identified areas of improvement and suggest the following based on a human-centred, HIC approach:
-
Include cultural, social, racial and ethnic characteristics as independent variables in the automatized matching system, so as to better incorporate the values and needs of the stakeholders according to the child welfare literature of the past two decades;
-
Invest in ways to incorporate contextual-awareness into algorithms so that they can be counseling tools for social workers and designated professionals, rather than last resort decision making protocols;
-
Political actors, CWS professionals and researchers to focus on building placement prediction algorithms having in mind trade-off between risk-assessment and matching characteristics for positive outcomes in the future of the foster children;
-
Move further than easily accessible and quantifiable features; invest in predicting and/or configuring more abstract decisive predictors associated with positive outcomes, such as parenting skills, conflict resolution skills etc.;
-
Reform foster care system : target recruitment strategies, improve service and treat parents as partners, foster parent training process to support them, remove unnecessary education and home requirements, f.i. by creating a federal list of requirements and bigger sanctions for non-compliance with the Multiethnic Placement Act.
Annex
Table 1 : Source : United States Department of Health and Human Services, Administration for Children and Families (2021)
| Race/Ethnicity | Percentage | Number |
|---|---|---|
| American Indian/Alaska native | 2% | 9,851 |
| Asian | 1% | 2,061 |
| Black or African American | 23% | 92,237 |
| Native Hawaiian/Other Pacific Islander | 0% | 1,070 |
| Hispanic (of any race) | 22% | 88,111 |
| White | 43% | 175,870 |
| Unknown/Unable to determine | 1% | 5,597 |
| Two or more races | 8% | 31,669 |
Google notebooks
-
RQ1 & RQ2: https://colab.research.google.com/drive/1giwlLJAF9sC3hJM7hjSvUdG-VT7FyHIh?usp=sharing
-
RQ3: https://colab.research.google.com/drive/1h_fD9-K_Ys9AIHEGbXf0PGo_SuR1iAk0?usp=sharing
References
Institutional sources
AFCARS Report. (2021). Preliminary FY 2020 Estimates as of October 04, 2021 - No.28 U.S. Department of Health and Human Services, Administration for Children and Families, Administration on Children,Youth and Families, Children’s Bureau
Senator Mike Lee, Republicans Joint Economic Committee, (2020) “A place to call home improving foster care and adoption policy to give more children a stable family”, U.S Senate and Congress
Peer reviewed articles and academic articles
Baccara, M., Collard-Wexler, A., Felli, L., & at Yariv, L. (2014). Child-adoption matching: Preferences for gender and race. American Economic Journal: Applied Economics, 6(3), 133–158. https://www.jstor.org/stable/43189492
Church, C. E., & Fairchild, A. J. (2017). In search of a silver bullet: Child Welfare’s embrace of predictive analytics. Juvenile and Family Court Journal, 68(1), 67–81. https://doi.org/10.1111/jfcj.12086
Leslie, L. K., J. N. Gordon, K. Lambros, K. Premji, J. Peoples, & Gist, K. (2005). Addressing the developmental and mental health needs of young children in foster care. J Dev Behav Pediatr, 26(2), 140–51. 10.1097/00004703-200504000-00011
MacDonald, D. E. (2019). Foster care: A dynamic matching approach, Job Market Paper. https://economia.uc.cl/wp-content/uploads/2019/09/PAPER-DMacDonald-TE.pdf
Mezulis, A. H., Abramson, L. Y., Hyde, J. S., & Hankin, B. L. (2004). Is there a universal positivity bias in attributions? A meta-analytic review of individual, developmental, and cultural differences in the self-serving attributional bias. Psychological Bulletin, 130(5), 711–747.
Moore, T. D., McDonald, T. P., & Cronbaugh-Auld, K. (2016). Assessing risk of placement instability to aid foster care placement decision making. Journal of Public Child Welfare, 10(2), 117–131. https://doi.org/10.1080/15548732.2016.1140697
Saxena, D., Badillo-Urquiola, K., Wisniewski, P. J., & Guha, S. (2020). “A human-centered review of algorithms used within the US child welfare system”. In Proceedings of the 2020 CHI Conference on Human Factors in Computing Systems (pp. 1–15).
Tushnet, R. (2018). The difference engine: Perpetuating poverty through algorithms. Jotwell, (reviewing Virginia Eubanks, Automating Inequality: How High-Tech Tools Profile, Police, and Punish the Poor (2018)). https://cyber.jotwell.com/the-difference-engine-perpetuating-poverty-through-algorithms/
Press articles
Mesa, B. (2022, March 15). Kansas wants more black foster parents to better match families with kids in crisis, Kcur. https://www.kcur.org/news/2022-03-15/kansas-wants-more-black-foster-parents-to-better-match-families-with-kids-in-crisis
Data
Adoption and Foster Care Analysis and Reporting System (AFCARS), Foster Care File 2015. National Data Archive on Child Abuse and Neglet. https://www.ndacan.acf.hhs.gov/datasets/dataset-details.cfm?ID=200
Kids Count Data Center. (2021). Child population by race and ethnicity in the United States. https://datacenter.kidscount.org/data/tables/103-child-population-by-race-and-ethnicity#detailed/1/any/false/2048,574,1729,37,871,870,573,869,36,868/68,69,67,12,70,66,71,72/423,424
United States Census Bureau. (2021). https://www.census.gov/quickfacts/fact/table/US/PST045221
General Information: Human-Computer Interaction (HCI), Interaction Design Foundation: https://www.interaction-design.org/literature/topics/human-computer-interaction